Over the weekend of 26th-27th October, Assembly along with the PropertyLimBrothers team, hosted the Property Summit 2024. We were honoured to welcome over 70 knowledge-hungry attendees, who engaged with PLB’s expert speakers and invited industry leaders across 17 sessions, covering key topics like Singapore’s property trends, refinancing strategies, and more.
One of the central topics, presented by our co-founder and CEO, Melvin Lim, focused on the current trends in Singapore’s property market, as well as the direction as we head into 2025.
In Singapore’s condominium market, a new trend is emerging: the price gap between new and resale condos is narrowing. After years of a widening disparity, this shift signals a potential turning point, as buyers reconsider their options between new and resale properties. This evolving trend is captured in PLB’s proprietary framework: the Disparity Effect.
New condos remain highly popular, especially for their extended leases compared to resale units and their modern conveniences, such as smart home technology. These features appeal to buyers seeking up-to-date amenities while reducing renovation costs. Conversely, resale condos offer immediate availability, a significant advantage for buyers in need of ready housing or investors looking to secure rental income promptly, sometimes even with existing tenants.
In this article, we dive into a comparative analysis of new launch and resale condominium prices across Singapore, exploring how this shift in price dynamics is reshaping buyers’ preferences and impacting the broader property market.
With 2024 seeing a surge in new launches—16 projects throughout the year, including freehold developments like Kassia, Meyer Blue, and Bagnall Haus—the market has experienced a substantial increase in supply. Understanding these evolving price trends is crucial for buyers as they navigate the landscape and make well-informed decisions on entering at the right price points.
Macro Movements
Before we dive into the microeconomic factors affecting new launches, it is meaningful to look at some of the macroeconomic factors that are affecting the broader real estate market.
Surge in Government Land Sales (GLS) and Increased Residential Supply
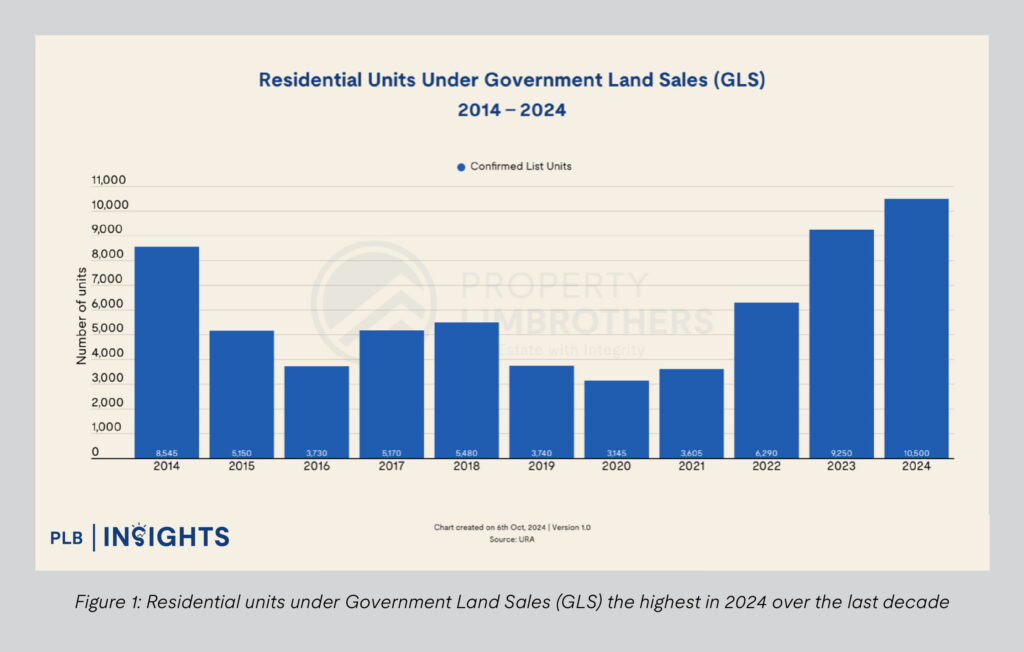
On October 17, the Urban Redevelopment Authority (URA) and Housing Development Board (HDB) announced the release of four sites under the second half of the 2024 Government Land Sales (GLS) Programme. This brings the total supply of private residential units for 2024 to 11,110, including 610 units from the activated Reserve List site at Zion Road (Parcel B)—the highest yearly supply since 2013.
This surge in GLS units represents a 13.5% increase from the 9,250 units offered in 2023, highlighting the government’s proactive efforts to boost residential supply and address housing demand. By increasing the number of units available, the GLS programme aims to exert downward pressure on housing prices and cool the residential real estate market, which has experienced significant price growth since the COVID-19 pandemic.
Property Price Index in the Last Two Decades
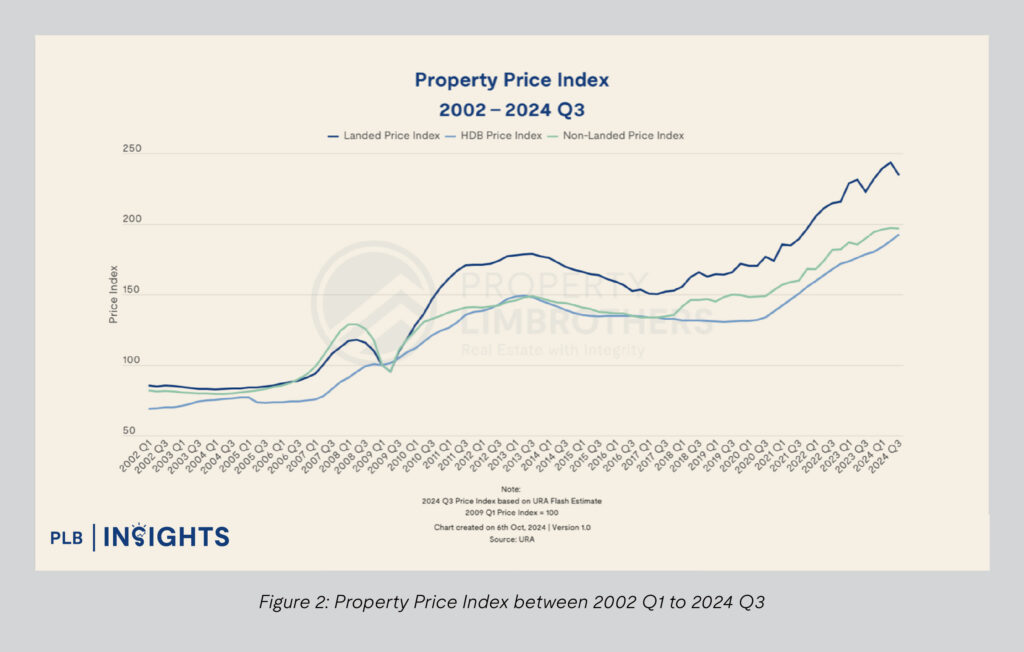
The Property Price Index (PPI) for landed properties, HDB flats, and private condominiums surged to new highs during the COVID-19 pandemic period. Overall, the private property index rose by 34% from the first quarter of 2020—when the PPI first experienced a COVID-related downturn—to the third quarter of 2024.
However, signs of a market shift emerged in Q3 2024. The overall nine month private housing prices increased by just 1.6% year-to-date, a marked slowdown from the 3.9% gain over the same period in 2023. In addition, prices for all private residential properties (including both landed and condominium units) decreased by 0.7% quarter-on-quarter (q-o-q) in Q3 2024, reversing the 0.9% q-o-q increase seen in Q2 2024.
Breaking it down further, landed property prices dropped by 3.4% q-o-q in Q3 2024, contrasting with a 1.9% rise q-o-q in the prior quarter. Meanwhile, non-landed property prices saw only a slight uptick of 0.1% in Q3 2024, down from the 0.6% increase recorded in the previous quarter.
This recent moderation in price growth is largely attributed to the cooling measures introduced by the government over the past two years, which have proven effective in tapering the rapid property price increases witnessed since the onset of the COVID-19 pandemic.
Disparity Effect© 2024
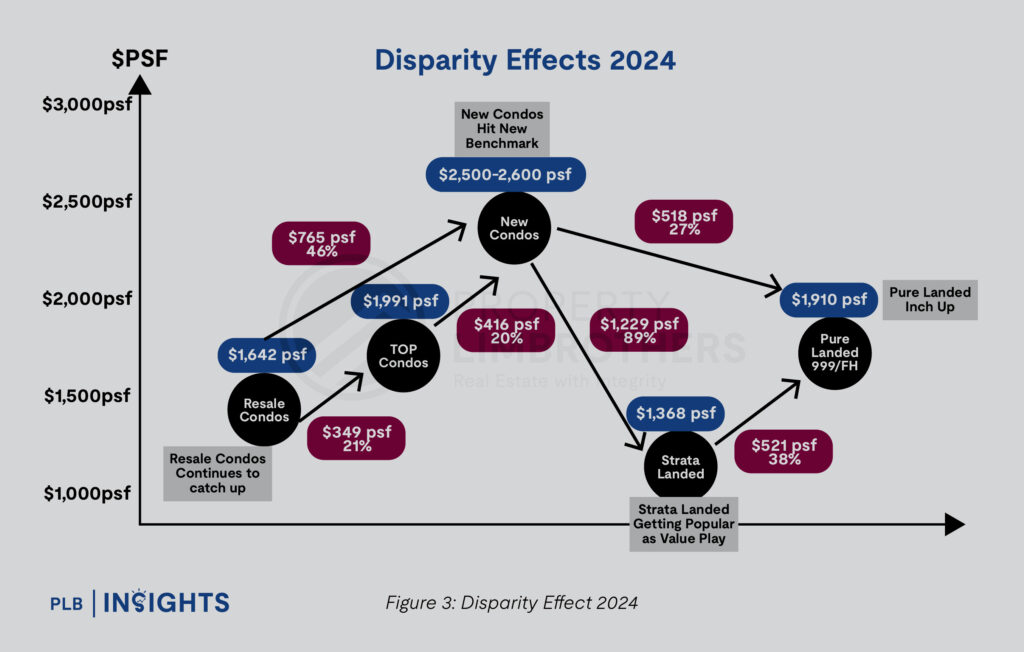
In 2024, property prices across Landed, Condominium, and HDB segments reached record highs, though the growth rate has slowed compared to previous years. The surge in resale prices set a new benchmark for the property market, which has influenced new launch prices. While these new launch prices are shaped by various factors, the record resale prices have significantly impacted pricing expectations across the market.
The narrowing price disparity among different property types in 2024 is driving buyers to consider upgrading to the next tier of properties with minimal additional investment. With new launch condos reaching a new benchmark of $2,500–$2,600 PSF, the price gaps between new condos, TOP condos, and resale condos have tightened. This shift means that for a modest price increase, consumers can access higher asset classes, moving from resale condos to TOP condos, or from strata landed properties to pure landed ones. The narrowing gap thus positions each asset class as a more achievable goal for those willing to “top up” slightly, aligning consumer demand with value-driven choices across property types. This trend illustrates the impact of reduced pricing gaps, as buyers weigh their options in a market where minimal additional investment can yield a considerable upgrade in property value and status.
Disparity Effect© from a Micro POV
This analysis delves into the current landscape of price disparity among various property types in Singapore, segmented by region and bedroom type. We explore asking prices for resale properties, new launches, and recently completed TOP projects across 1, 2, 3, 4, and 5-bedroom units. By analysing these price differences, we gain valuable insights into emerging trends and shifts in buyer preferences, highlighting how narrowing price gaps could potentially influence consumer choices and shape demand across the property market.
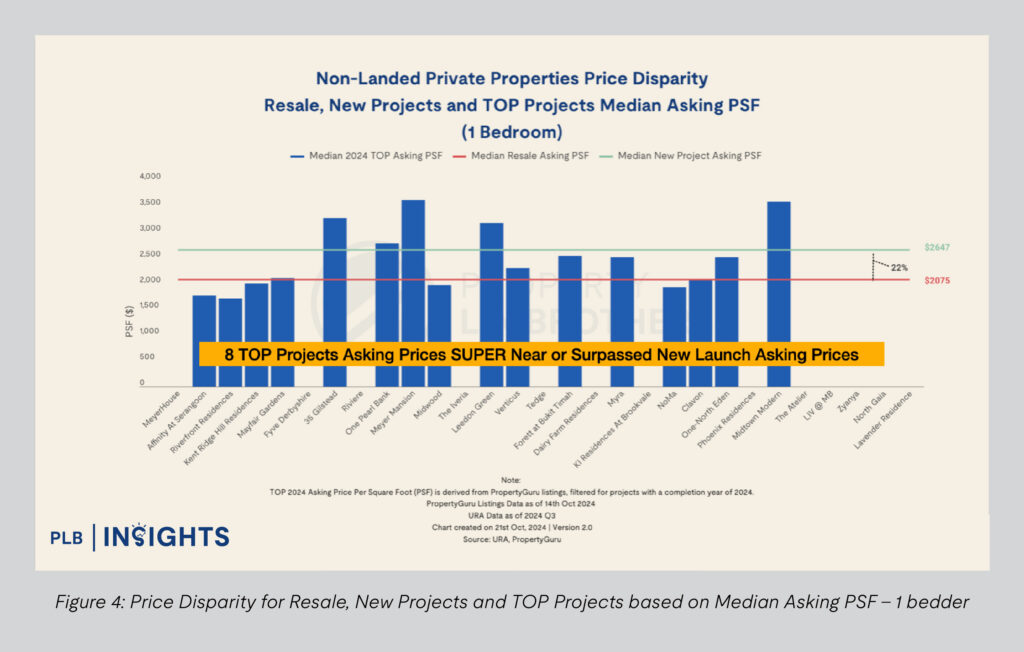
The asking prices for certain TOP condominiums have closely approached or, in some cases, surpassed the asking prices of new launch condominiums in 2024. This narrowing disparity, as shown by the median asking PSF price, suggests a shift in market dynamics where the premium associated with newly launched projects is becoming less pronounced for buyers considering TOP projects.
Specifically, eight TOP projects are now pricing competitively near or even above new launch levels. This trend reflects how selective TOP projects are commanding high asking PSF prices as overall resale property prices soar in the last few years. With a 22% gap between the median asking PSF price for TOP and new launch projects, this convergence may influence buyer preferences, leading them to favour the next best asset class—the new launch projects which also enjoy longer lease tenures due to their newness nature.
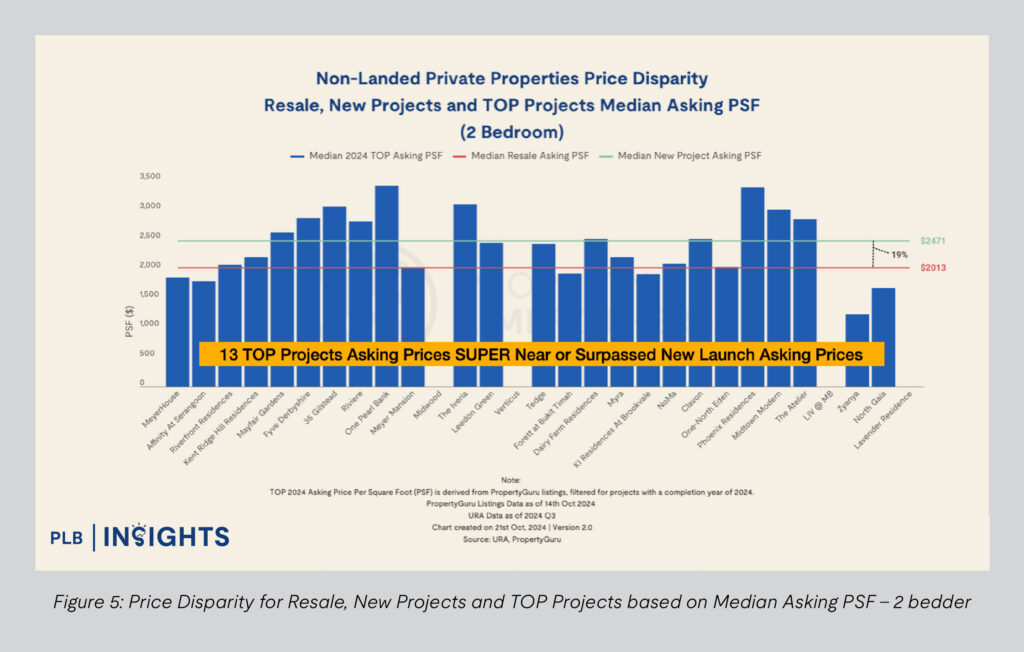
The chart for 2-bedroom non-landed private properties in 2024 reveals a narrowing price disparity between TOP projects and new launches. With a median asking PSF price of $2,013 for TOP units and $2,471 for new launches, the difference is just around 19%. This reduced gap suggests that for a relatively small premium, buyers can opt for brand-new developments over recently completed TOP units.
As TOP projects now command prices close to those of new launches, the incentive for buyers to choose new launch projects increases. This is particularly compelling for those looking for the latest amenities, longer lease tenures, or the novelty factor associated with new developments. The diminishing premium for new launches compared to TOP properties may lead to a shift in buyer preference towards new launches, as they offer added value for a marginally higher price point.
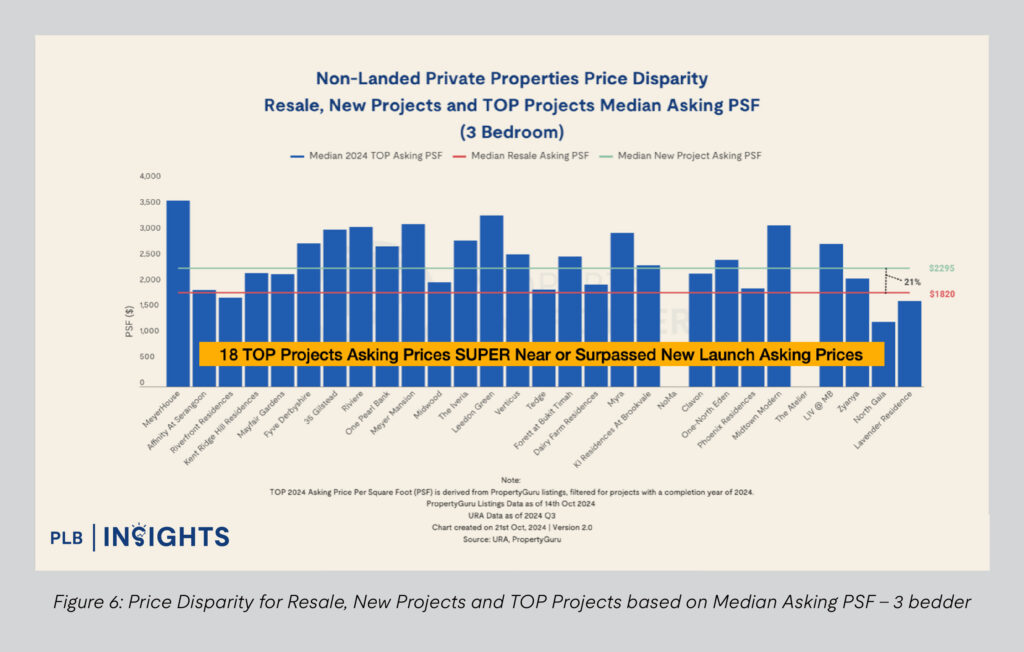
Similar to the trend observed with 1-bedder and 2-bedder units, the 2024 asking prices for 3-bedroom TOP projects have closely approached those of new launches. With the median TOP asking PSF price at $2,295 and new launches at $2,820—a 21% difference. 18 TOP projects now price near or above new launch levels. This convergence in pricing is likely to push buyers towards new launches, where the marginal price increase offers advantages like a longer lease and the appeal of a brand-new development.
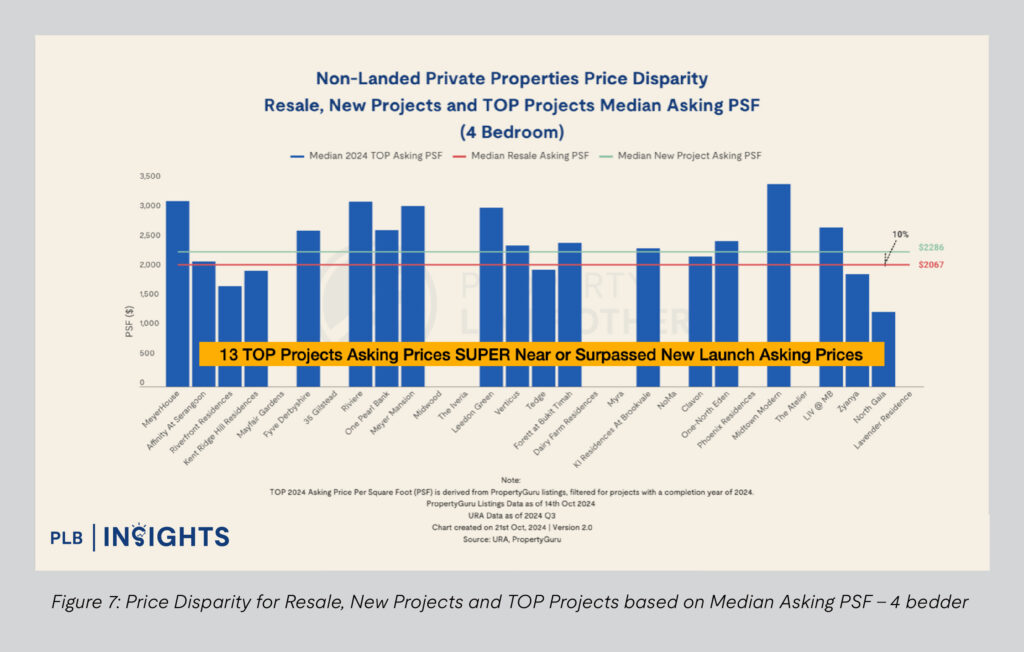
In line with the trend seen in the 1-bedder, 2-bedder, and 3-bedder categories, the 2024 asking prices for 4-bedroom TOP projects are closely tracking those of new launches. With a narrow 10% price gap, where median TOP asking PSF is at $2,286 compared to $2,067 for new launches, 13 TOP projects have either matched or surpassed new launch prices. This minimal disparity suggests that buyers may find new launch projects more attractive, especially given the extended lease periods and brand-new features offered, making them a preferable option over similarly priced TOP projects.
By Region
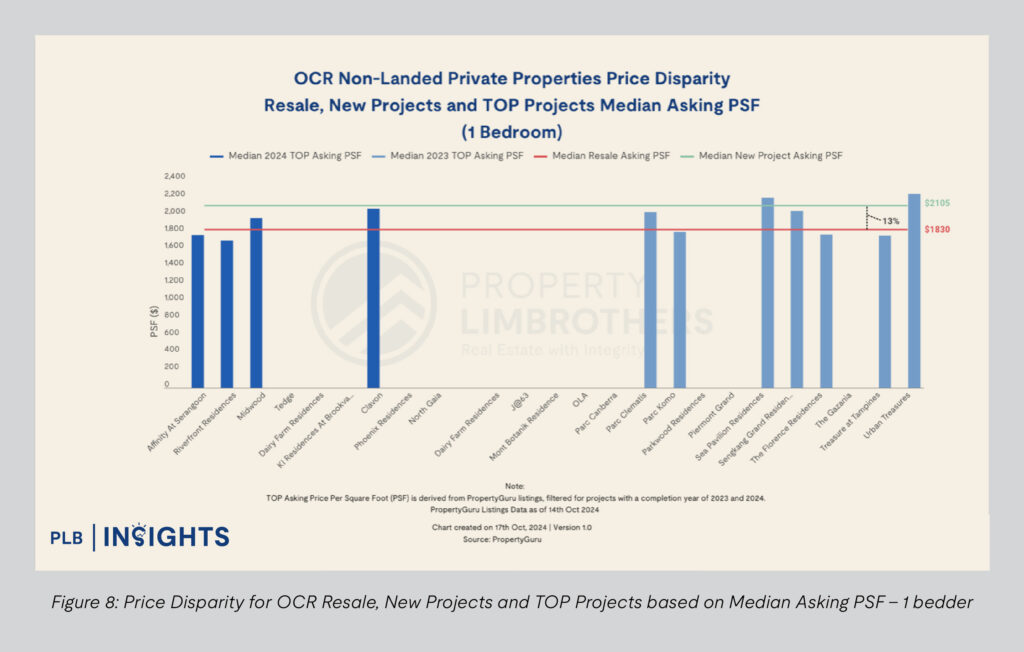
While we note that not all projects comprise the 1-bedder unit type, those with 1-bedder units saw a narrowing disparity effect too. Five projects have reached or surpassed the median new launch PSF, reinforcing the appeal of new launches as a more favourable purchase choice, especially given the advantages of a newer property and potentially longer lease tenure. This 13% price gap suggests that buyers are more inclined towards new launches over TOP projects when prices are comparable.
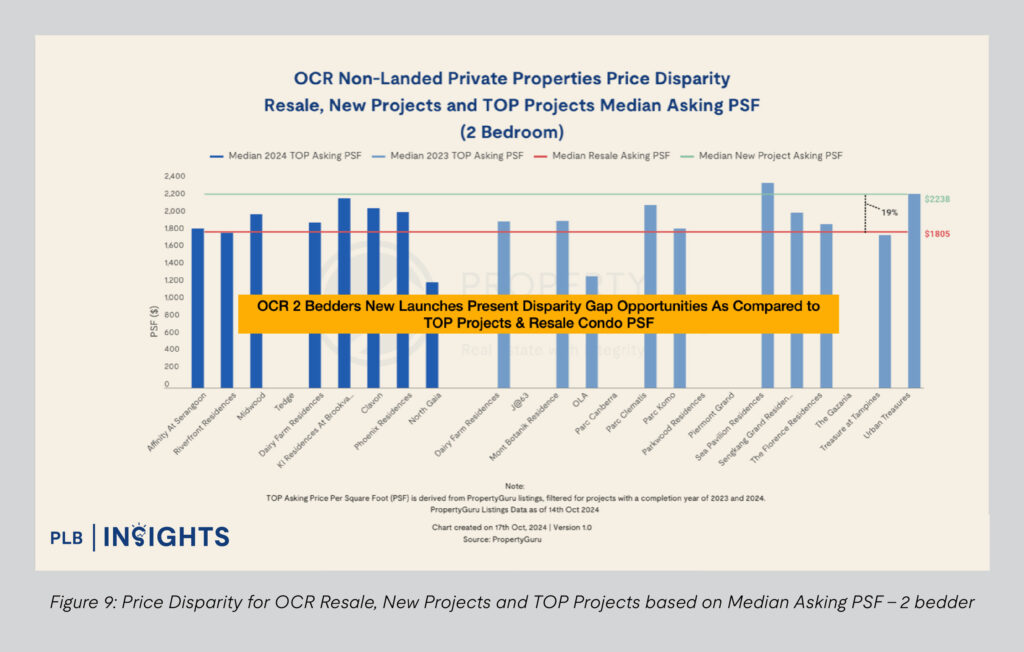
For OCR 2-bedroom units, the price disparity presents an opportunity, with the new launch asking PSF price showing a 19% premium over TOP and resale projects. This significant gap reinforces the appeal of resale and TOP projects as cost-effective options, while also highlighting the premium that buyers have to pay to enter new launches. With many TOP projects still priced below the median new launch level, buyers might find more value in TOP projects for 2-bedders in the OCR. However, the narrowing gap could prompt those who prioritise lease tenure and newer facilities to lean towards new launches, similar to the trends observed in 1-bedroom units.
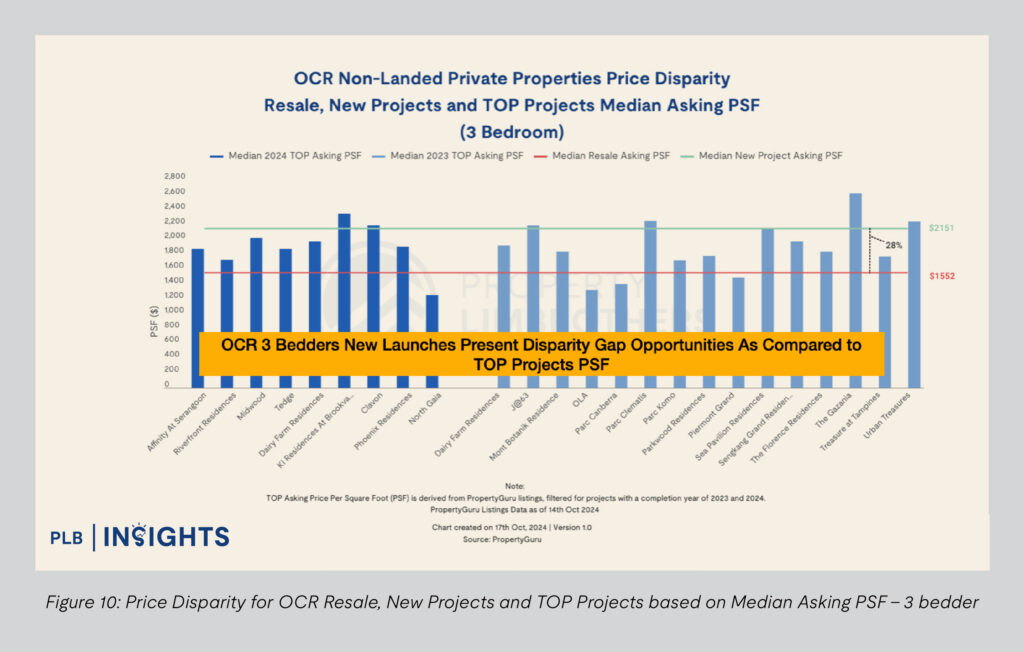
For OCR 3-bedroom units, the price disparity gap is more pronounced, with the new launch median asking PSF prices set at 28% premium over TOP projects. Similar to the trends observed in the 1- and 2-bedroom categories, this gap reinforces the value perception for TOP projects among budget-conscious buyers. However, the significant premium may encourage those prioritising newer amenities and extended lease tenures to lean towards new launches. This disparity creates a clear choice for buyers depending on their preference for value versus recency and longevity of the asset.
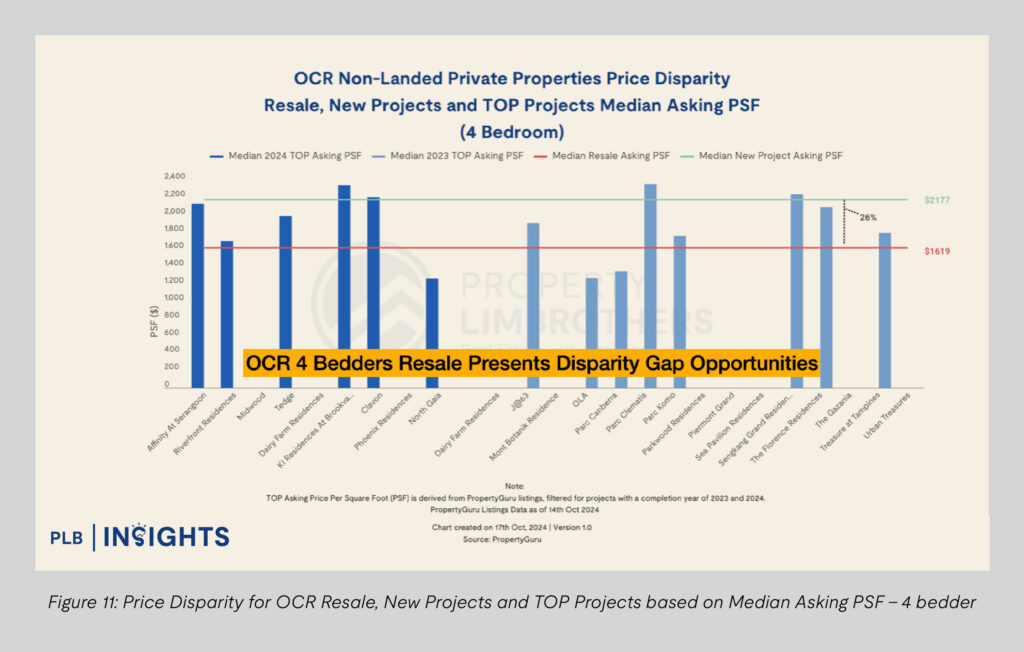
For OCR 4-bedroom units, resale properties show a considerable disparity gap, with a 26% lower median asking PSF price compared to new launches. This gap highlights a compelling value opportunity for buyers prioritising larger spaces, as resale units present a more cost-effective option in this category. Similar to the trends in smaller unit types, the premium for new launches remains significant, appealing to buyers looking for newer builds and updated amenities. However, for those focused on maximising space at a lower PSF price, resale units in this segment offer a financially advantageous choice.
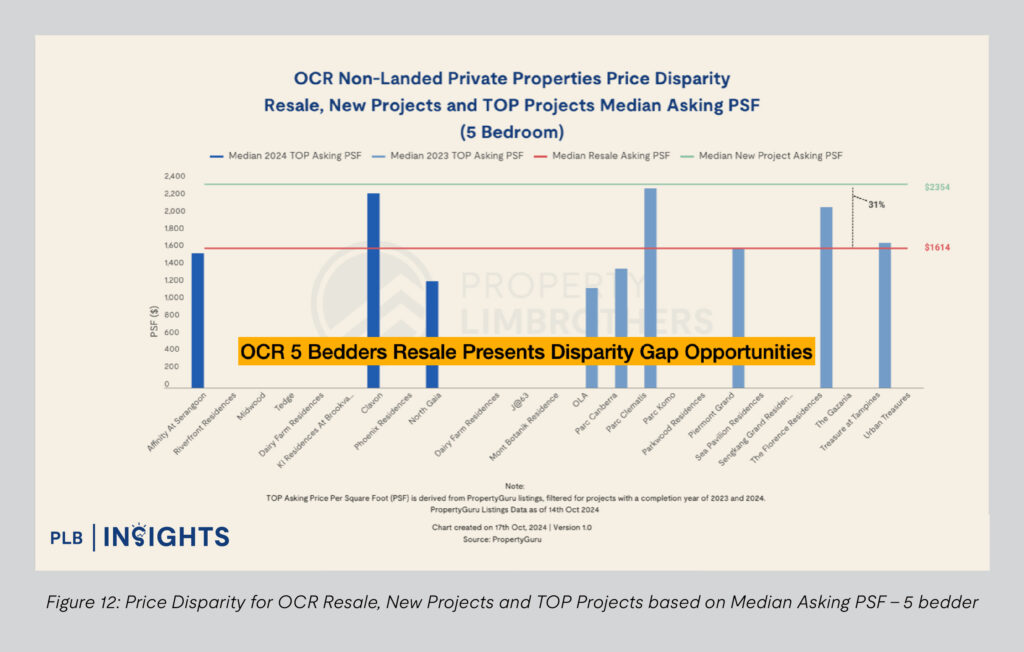
Similar to the trend observed in OCR 4-bedroom units, OCR 5-bedroom units show a substantial price disparity between resale and new launch options, with resale units priced 31% lower on a median asking PSF price basis. This wide gap emphasises the value opportunity for buyers looking at larger living spaces, as resale options provide a more economical pathway without the premium associated with new launches.
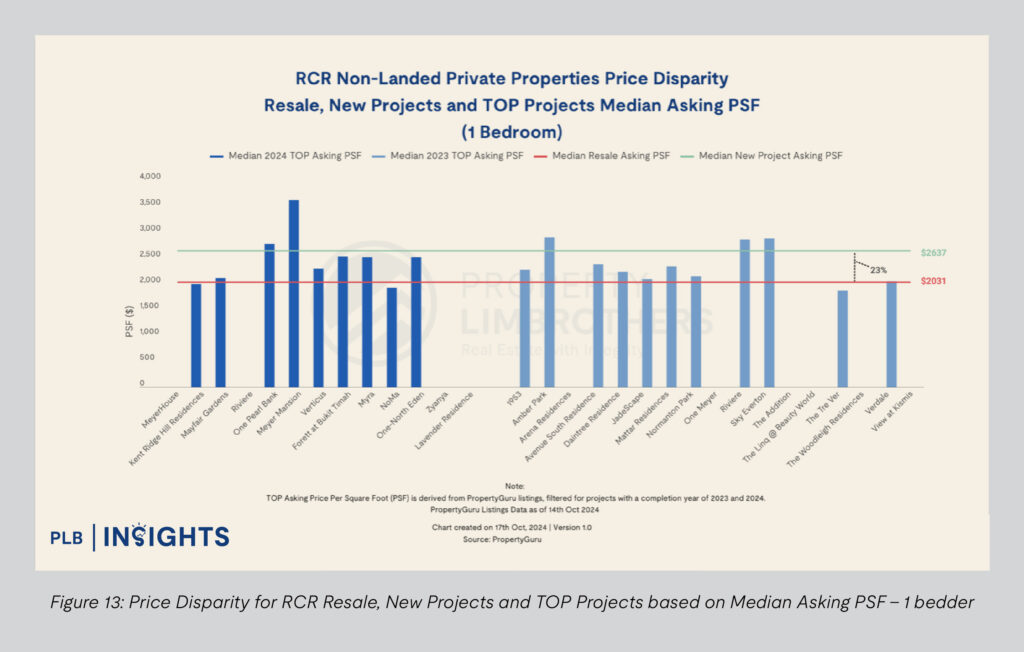
In the RCR segment for 1-bedroom units, the price disparity between resale and new launch projects remains pronounced, with a 23% gap in median asking PSF price. This pattern, similar to OCR segments, highlights a distinct price gap where resale properties provide a more affordable option, while new launch prices maintain a premium. With eight projects nearing or surpassing the new launch PSF, the narrowing disparity suggests a competitive environment where new launches might still be perceived as favourable, particularly for buyers prioritising longer lease tenure and modern amenities. This price proximity could influence purchasing choices, drawing more interest to new launches as they offer a distinct set of value propositions over resale.
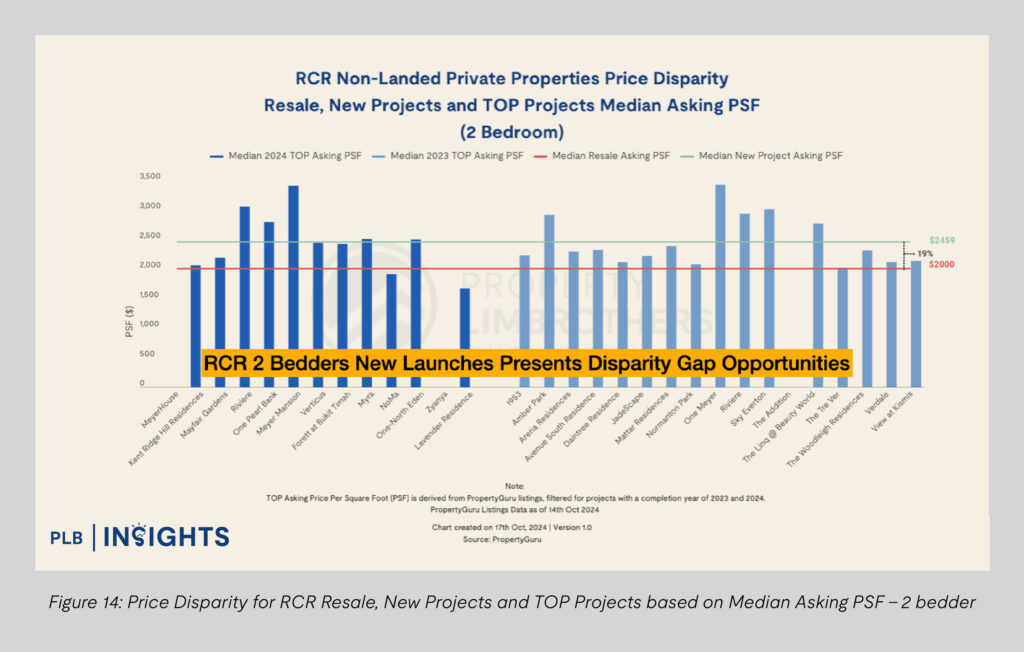
In the RCR segment for 2-bedroom units, new launches present better opportunities due to a 19% price gap compared to resale options. With median new project asking PSF price at $2,459 versus $2,000 for resale, this narrower disparity may encourage buyers to opt for new launches.
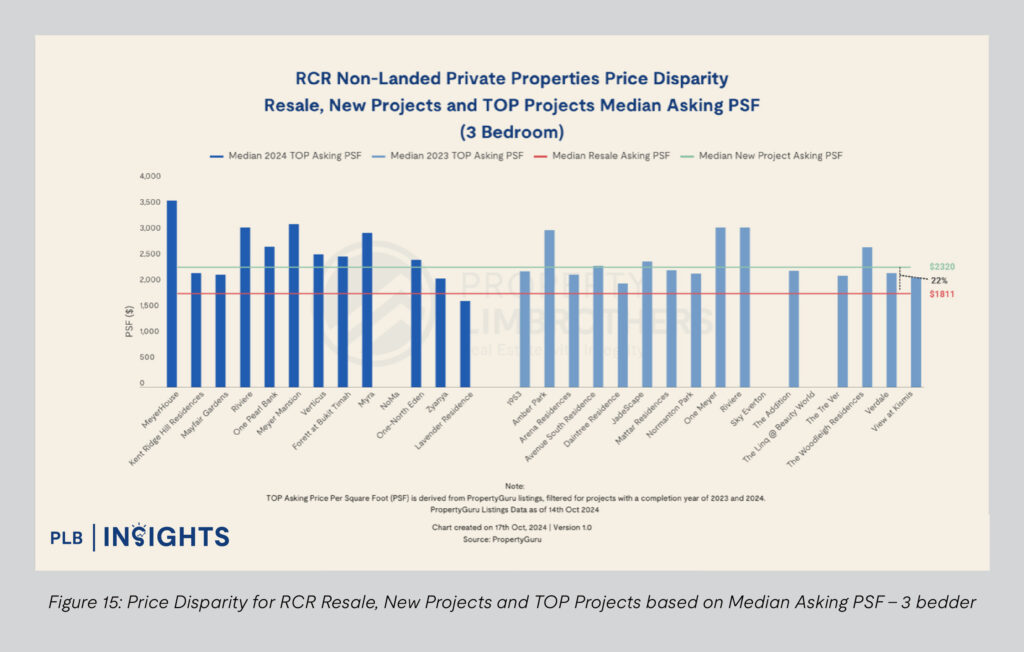
In the RCR segment for 3-bedroom units, 13 TOP projects have asking prices that either meet or exceed the new launch median asking PSF of $2,320. This substantial number of TOP projects priced on par with or higher than new launches highlights a significant narrowing in price disparity. As the gap closes, buyers are better toward purchasing new launches, benefiting from the narrowing price gap, advantages of newer facilities and longer lease tenures. This trend underscores the strong position of new launches as an attractive option in terms of value and investment potential in current market conditions.
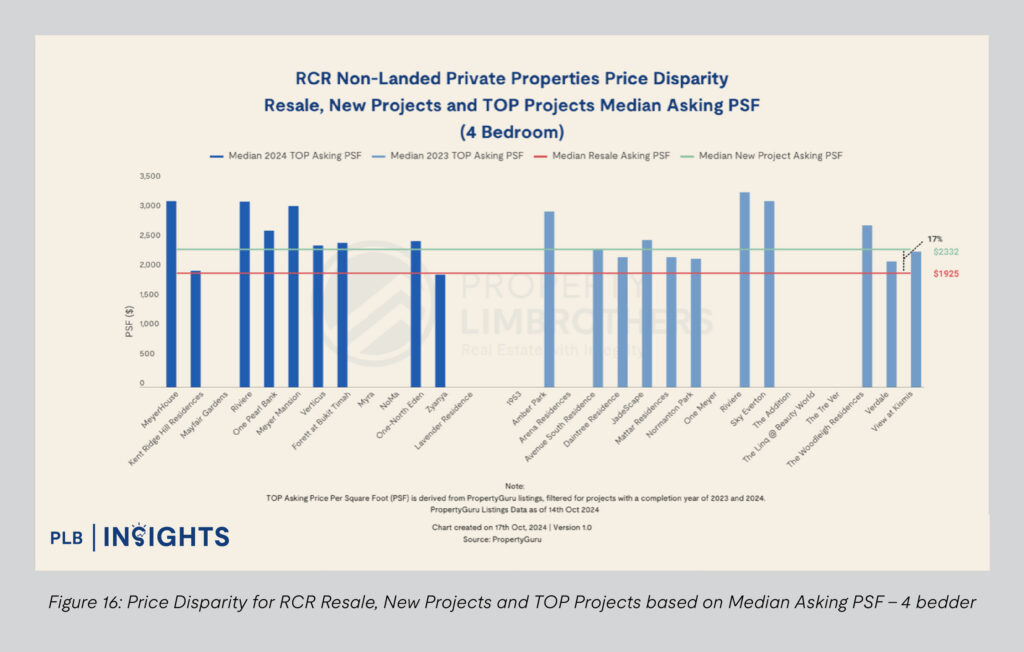
In the RCR segment for 4-bedroom units, we observe that 13 TOP projects have asking PSF prices that are either on par with or exceed the new launch median of $2,332. This further underscores the trend where certain TOP projects are approaching or surpassing new launch price levels. With a price gap of only 17%, buyers may find new launches increasingly attractive. This narrowing disparity signals that new launches are positioned as favourable options, appealing to buyers who are weighing the marginal premium against the perceived value of TOP units.
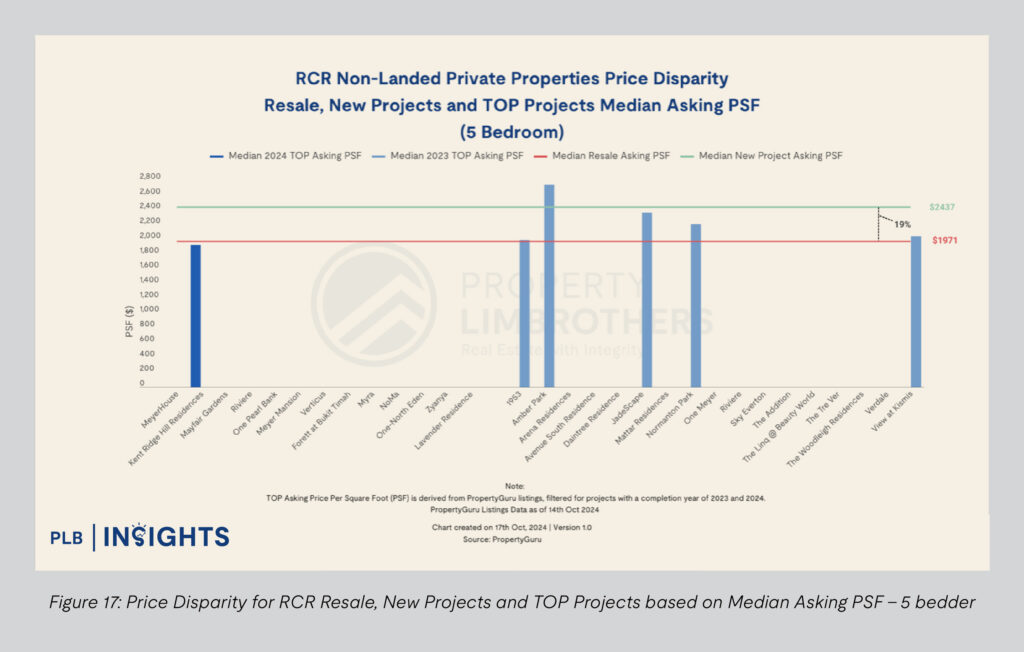
In the RCR segment for 5-bedroom units, the price disparity stands at 19%, with the median asking PSF for new launch projects at $2,437, while the median resale price is $1,971. While fewer projects feature 5-bedroom units, the narrowing gap indicates that new launches offer competitive value in this segment, especially as buyers consider the potential advantages of newer developments. Given the 19% premium, prospective buyers in the 5-bedroom category may find new launches appealing.
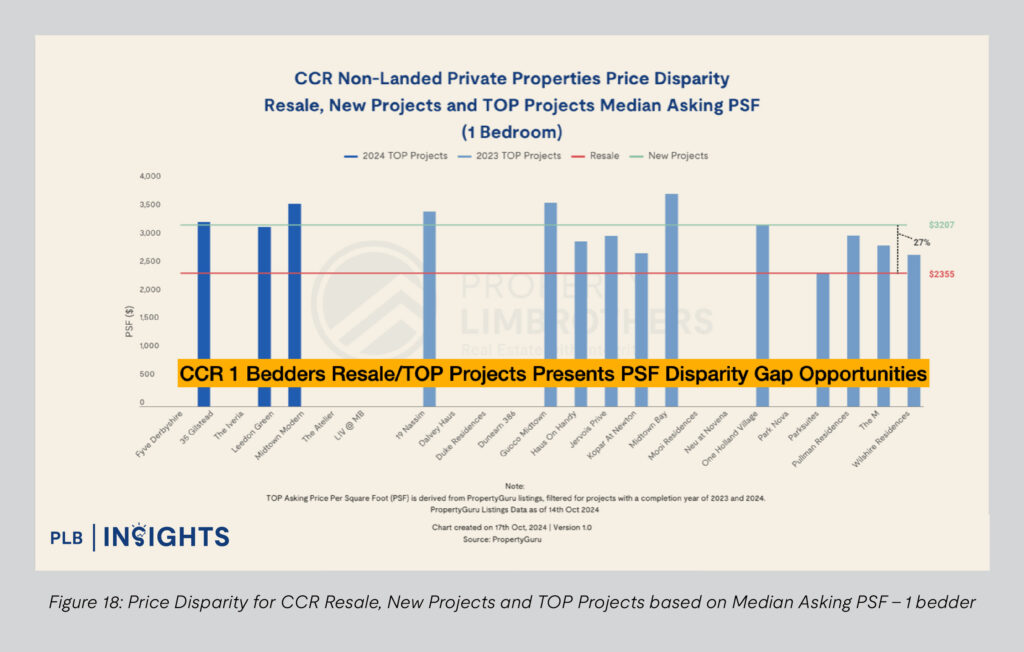
In the CCR for 1-bedroom units, the price disparity between new launches and existing TOP and resale projects is more evident than OCR and RCR, presenting opportunities for resale and TOP projects. The median new project asking PSF price is set at $3,207, approximately 27% higher than the median resale price of $2,355. This gap suggests that buyers may find more value in resale and recently TOP units, as they offer a lower entry price point while still located in the highly desirable CCR.
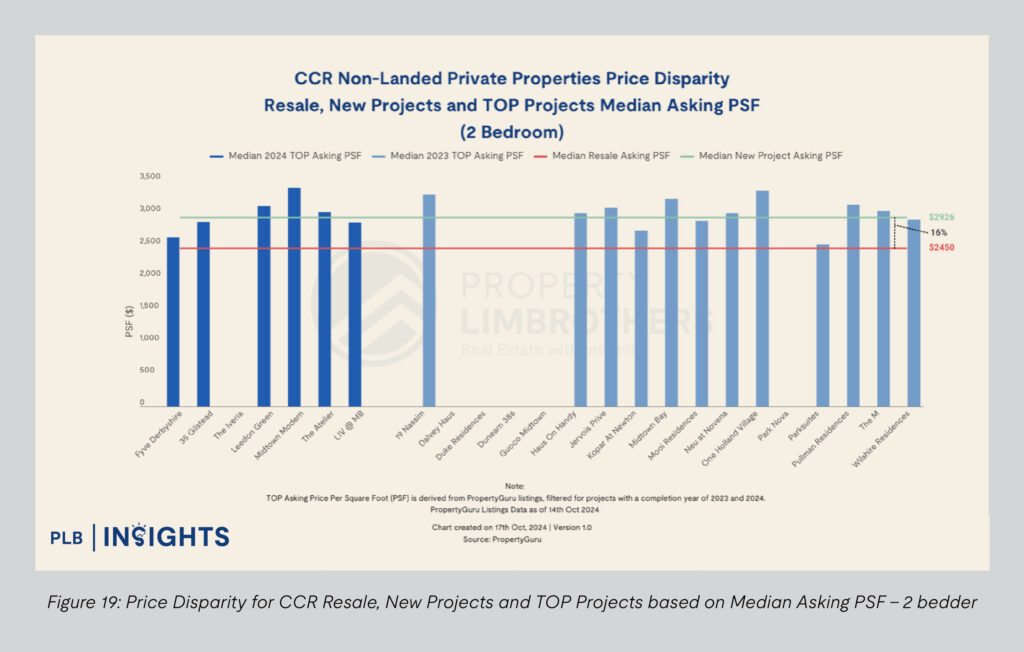
In the CCR 2-bedroom segment, the data indicates a trend favouring new launches, as these projects command a median asking PSF of $2,926, which is 16% higher than the median resale price of $2,450. This premium suggests that buyers see added value in new launches, likely due to their modern amenities, fresh leases, and enhanced investment appeal. A handful of TOP projects, such as Midtown Modern and Leedon Green, come close to or even match new launch prices, underscoring a buyer preference that leans towards new projects despite premiums.
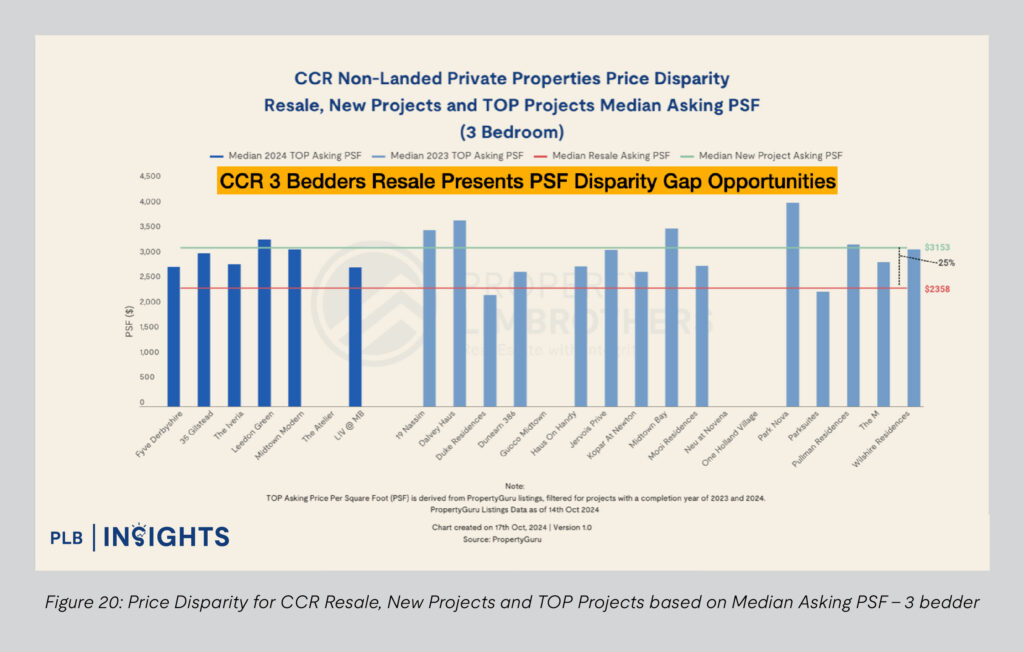
In the CCR 3-bedroom segment, the price disparity underscores strong opportunities in the resale market. With the median resale PSF at $2,358—significantly lower than the new launch median of $3,153—buyers stand to gain considerable value by opting for resale units. This 25% price gap makes resale units particularly attractive for those seeking prime CCR locations without the premium price tag associated with new launches. While certain TOP projects, such as Midtown Modern and Leedon Green, approach new launch price levels, the more accessible pricing in the resale segment presents an appealing alternative.
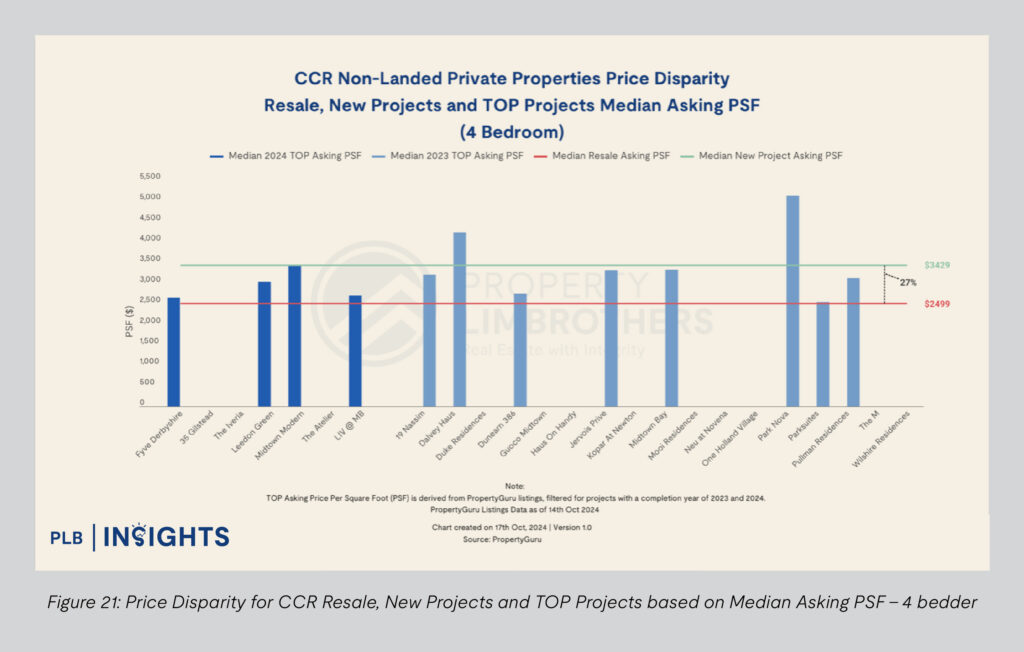
Similarly to the 3-bedder category, the 4-bedder CCR segment also highlights significant PSF disparity gaps that favour resale units. With the median resale PSF price standing at $2,499, compared to $3,429 for new launches, there is a considerable 27% price gap. This gap presents value-driven buyers with a compelling case to consider resale options at a significantly lower price point.
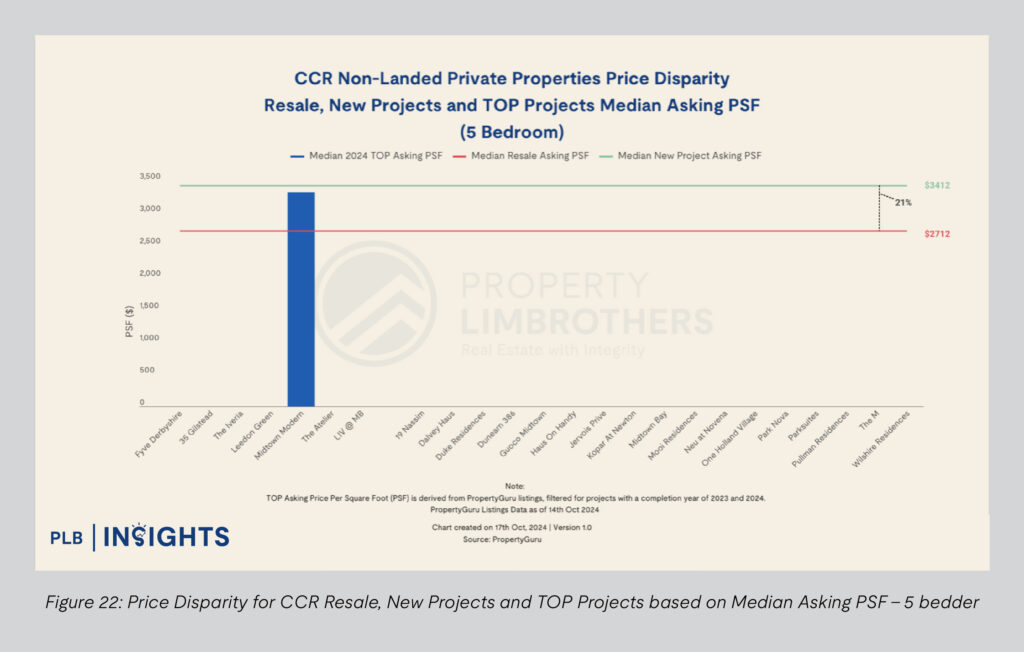
In the CCR 5-bedder category, there is a noticeable scarcity of TOP projects, with only Midtown Modern being represented. This limited selection highlights a substantial gap in the supply of larger 5-bedroom units within the CCR. The median PSF price for new launches is $3,412, showing a 21% disparity over the median resale PSF price of $2,712. This lack of options among TOP projects may steer buyers towards older resale or new launches, especially for those seeking expansive living spaces in prime CCR locations.
Disparity Effect 2025
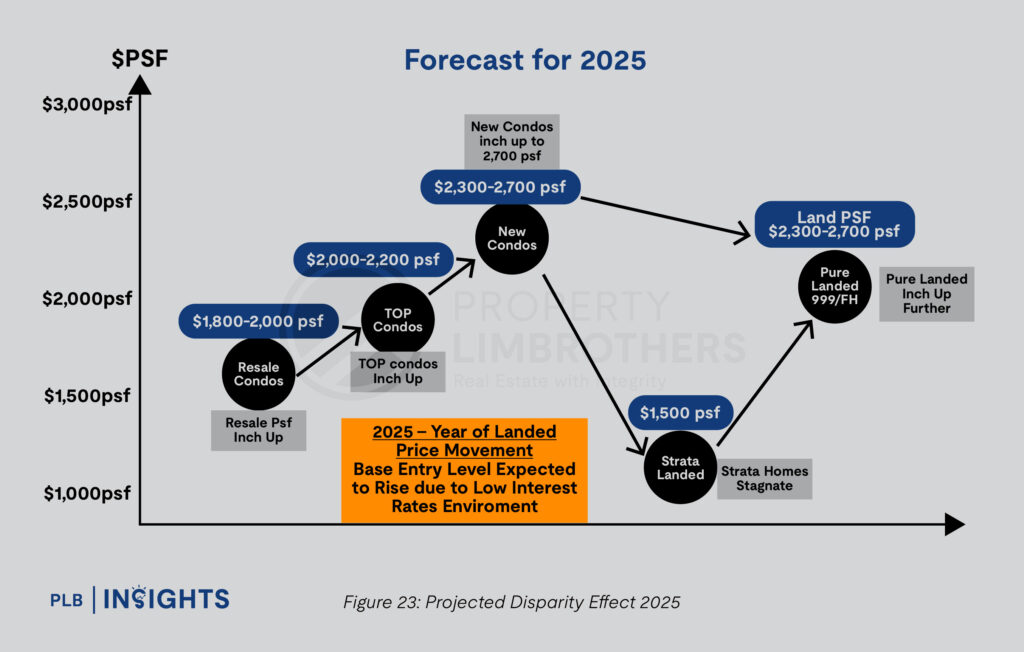
Interest rates saw their first cut in September 2024, with multiple reductions anticipated over the next two years. This easing is expected to shift the outlook from a potential “hard landing” or economic recession in the U.S. to a softer landing. Lower interest rates introduce more liquidity into the market, reducing the cost of borrowing, which in turn fuels demand. As borrowing becomes more affordable, the property market is likely to shift towards a seller’s market in 2025, with increased buyer activity and transaction volumes supporting upward price movement across various property segments.
The forecast for new launch condos in 2025 indicates an increase to $2,300–$2,700 PSF, establishing a new threshold. As resale condos edge up to the $1,800–$2,000 PSF range, the narrowing gap between resale, TOP, and new condos suggests a market trend where incremental top-ups offer access to newer, higher-value assets. This shift aligns with consumer preference for maximising value, enabling a smoother transition from resale to TOP condos and even from strata to pure landed properties.
In the landed property segment, pure landed freehold properties are projected to inch up within the $2,000–$2,300 PSF range, while strata landed prices are expected to stagnate around $1,500 PSF. This contrasts with the stronger upward trajectory anticipated for pure landed properties, positioning them as a more appealing asset class for buyers seeking long-term value retention. The 2025 outlook underscores a market primed for upward movement across asset tiers, as affordability—supported by lower interest rates—encourages buyers to stretch for more premium property classes.
Conclusion
In summary, the landscape of Singapore’s property market is poised for significant shifts as we head into 2025. With a macroeconomic backdrop of easing interest rates, the outlook suggests a soft landing in the broader economy underpinned by a surge in market liquidity and lower borrowing costs. This environment is set to favour a seller’s market, with heightened demand anticipated across various property segments as financing becomes more accessible.
Our Disparity Effect, which has been central to analysing the market dynamics in 2024, reveals an increasingly narrow price gap between property types—particularly among new launches, TOP, and resale condos. This convergence is reshaping buyers’ behaviour, positioning each property class as a more attainable step-up for those seeking to upgrade with a minimal additional outlay. Moving into 2025, we expect these price gaps to continue closing, making newer properties, like TOP projects and new launches, more compelling options for those willing to pay a modest premium for extended leases and modern features. This trend not only underscores the influence of record resale prices but also highlights the competitive edge that new launches are gaining, especially as they establish a new PSF benchmark.
Breaking it down by regions, the OCR, RCR, and CCR each exhibit distinct pricing dynamics that cater to varying buyer preferences. In the OCR, larger resale units present value-driven opportunities, particularly for families seeking spacious homes without the premium associated with new launches. In contrast, the RCR shows a narrowing disparity, especially in 1- and 2-bedroom segments, where TOP and resale units remain attractive due to more favourable price points compared to newer developments. Meanwhile, the CCR maintains a wider price disparity between resale and new launches, especially in larger units, providing high-value alternatives in the resale market for those prioritising prime locations at a lower cost.
In essence, the 2025 outlook suggests a dynamic property market where strategic entry points and value-driven choices are key. Buyers will find opportunities to access higher-tier properties across all regions as affordability improves, while sellers stand to benefit from the increased buyer demand brought about by a lower interest rate environment.
PLB New Launch MOAT Analysis
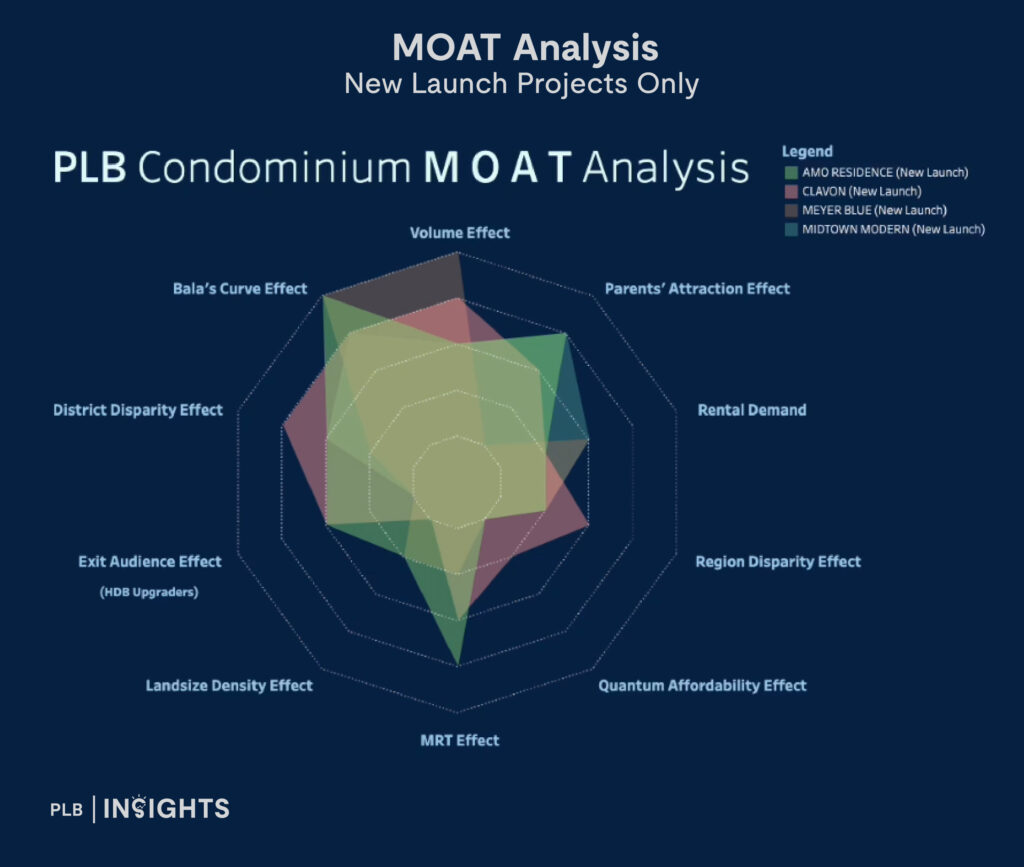
In addition, we have launched PLB’s very own proprietary New Launch MOAT Analysis. Building on the success of our proprietary Resale MOAT Analysis, this new tool is designed specifically to guide buyers and investors through the intricate landscape of new launch properties.
With the PLB New Launch Moat Analysis, we go beyond basic metrics to examine critical factors that impact long-term value, from location strength and developer reputation to future infrastructure developments and growth potential in surrounding areas. This comprehensive analysis offers a clear, data-driven evaluation, empowering you to make informed decisions on new launch investments with confidence.
Whether you’re a first-time buyer looking for a home or a seasoned investor seeking high-growth potential, our New Launch MOAT Analysis provides you with a competitive edge. At PLB, we’re committed to helping you sell your homes to their maximum potential and secure properties that not only hold their value but also thrive amidst market fluctuations. Contact us today!
Disclaimer: Information provided on this website is general in nature and does not constitute financial advice
PropertyLimBrothers will endeavour to update the website as needed. However, information may change without notice and we do not guarantee the accuracy of information on the website, including information provided by third parties, at any particular time. While every effort has been made that the information provided is accurate, individuals must not rely on this information to make a financial or investment decision. Before making any, we recommend you consult a financial planner or your bank to take into account your particular financial situation and individual needs. PropertyLimBrothers does not give any warranty as to the accuracy, reliability or completeness of information which is contained in this website. Except insofar as any liability under statute cannot be executed, PropertyLimBrothers, its employees do not accept any liability for any error or omission on this website or for any resulting loss or damage suffered by the recipient or any other person.


